Narragansett Bay: An Estuary of National Significance Results
of the Narragansett Bay Coastal Wetland Trend Analysis Maps
of Trends in Narragansett Bay Coastal Wetlands
|
|
Introduction Background Historical loss of coastal wetlands from natural and human disturbances is significant. These actions have resulted in the loss of important wetland values and functions that include fish, shellfish, and wildlife habitat, water quality improvement, and shoreline erosion control. As a result, there is growing interest in assessing the status and trends of coastal wetlands in Rhode Island. Such studies help measure the effectiveness of Federal and State wetland protection programs and laws, raise public awareness of wetlands, and create science-based plans to alter these trends. Recognizing the value of these resources, the Narragansett Bay Estuary Program (NBEP) secured the funding for and coordinated a series of three cooperative mapping projects to assess the Bay's coastal habitats. Inventory of Narragansett Bay Coastal Habitats In 1995, the NBEP formed partnerships with the University of Massachusetts-Natural Resources Assessment Group (UMass), R.I. Department of Environmental Management, Save the Bay, and the City of Warwick to characterize the Bay's estuarine habitats. Environmental scientists and planners from Federal and State agencies, local universities, and nonprofit organizations, provided technical support on the project. The following year, new aerial photographs of the Bay were taken to identify, classify, and map the coastal habitats. The project identified approximately 2,924 acres of salt marsh, 1,466 acres of beach, 582 acres of rocky shore, 569 acres of tidal flat, 656 acres of brackish/Phragmites marsh, 160 acres of salt shrub wetland, 100 acres of eelgrass beds, 46 acres of panne and pool, 43 acres of dune, 9 acres of oyster reef, and 3 acres of streambed habitats (Huber, 1999) The inventory provides baseline information on the Bay’s habitats from which to measure historical and future change. Inventory of Narragansett Bay Coastal Wetland Restoration Sites, Wetland Buffers, and Hardened Shorelines In 1998, building on this new information, the NBEP partnered with the U.S. Fish and Wildlife Service (USFWS), UMass., University of Rhode Island Environmental Data Center (URI-EDC), and Save The Bay to identify and map degraded coastal wetlands and potential restoration sites in the Bay. The methodology was modeled after a watershed-based approach to restoration planning work in Massachusetts performed by the USFWS and UMass. They further tailored the methodology to apply to estuarine wetlands in Narragansett Bay. Using aerial photo-interpretation and field investigations, the UMass. personnel identified, delineated, and classified the land use/land cover surrounding the Bay's coastal wetlands within a 500-foot buffer area, hardened shorelines, and two categories of potential coastal wetland restoration sites. The URI-EDC personnel then converted the photo-interpreted information into digital coverages and a geospatial database using GIS technology. Maps were created for the 26 Narragansett Bay coastal municipalities in Rhode Island and Massachusetts. The study identified over 4000 acres or a total of 236 potential coastal wetland restoration projects. Most (78%) of the acreage consisted of Type 2 degraded wetlands with onsite impacts such as ditches, impoundments, tidal restrictions, and excavation. The remainder of the area, 888 acres, was represented by Type I sites that are no longer coastal wetlands due to filling or draining, or that presently exist as submerged or freshwater wetlands. The land use/land cover within the 500-foot buffer of coastal wetlands was comprised of nearly evenly divided developed land and natural cover. In addition, over 133 miles of hardened shores (25 percent of the shoreline) were mapped with greater that 75 percent of these represented by bulkheads, revetments, and seawalls. The results of the study were incorporated into a GIS-based decision-making tool developed by NOAA Coastal Services Center to assist resource managers with the prioritization of coastal wetland restoration opportunities (Coastal Resources Management Council et al., 2003). The Tool can be used to promote a coordinated and systematic approach to restoration planning in Narragansett Bay. The acreage
summaries, technical reports, and downloadable spatial data from
the two projects described above are available on the Narragansett
Bay Coastal Wetland Restoration Analysis-Inventory of Potential
Restoration Sites, Wetland Buffers, and Hardened Shorelines CD-ROM.
The digital data is also available through the Rhode Island Geographic
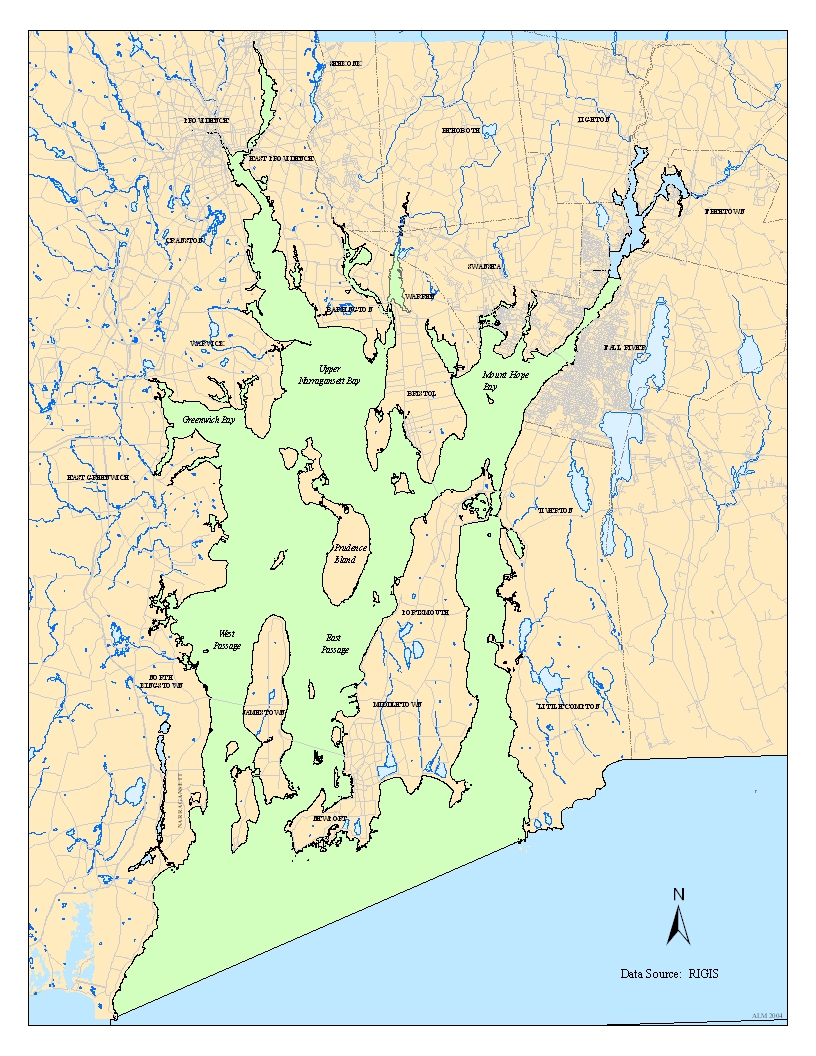
Information System (RIGIS) web site at www.edc.uri.edu/rigis. Project Description Inventory of the Rhode Island portion of the Narragansett Bay Coastal Wetland and Buffer Zone Losses, Gains, and Change from the 1950s to the 1990s; and 1930s to the 1950s at Six Demonstration Sites: In 1999, the Estuary Program continued working with the URI-EDC, USFWS, and UMass. to assess the changes in coastal wetlands and their buffers in the Narragansett Bay estuary. Using aerial photointerpretation from two time periods, the extent of loss (wetland to non-wetland), gain (non-wetland to wetland), and change in the classification (wetland to wetland) of coastal wetlands was identified in the Rhode Island portion of the Narragansett Bay estuary between the 1950s and 1990s era. The trends in land use and land cover were interpreted within a 500-foot buffer zone of the coastal wetland. In addition, further analysis of change was performed at six sites back to the 1930s. The areas were selected because of their ecological value, the history and extent of the on-site alterations, and the interests of the communities and resource managers to restore the sites. They include: 1) Allins Cove/West Shore, Barrington, R.I.; 2) Calf Pasture Point, North Kingstown, R.I.; 3) Jacobs Point, Warren and Bristol, R.I.; 4) Palmer River System, Warren, R.I. and Swansea, Mass.; 5) Sachuest Point, Middletown, R.I.; and, 6) Wesquage Pond, Narragansett, R.I. The wetland trends information was classified according to Cowardin et al., (1979) and follows the USFWS's National Wetlands Inventory (NWI) mapping standards. The smallest unit of change that was mapped in the study area was 0.25 acre. Codes were assigned to these areas to describe the causes of change resulting from natural and human disturbances, e.g., coastal erosion and deposition, agriculture. The land use and land cover in the buffer zone was classified using a modified Anderson (1976) method. The photointerpreted information was then converted into digital coverages and a geospatial database using geographic information system (GIS) technology. The database contains the acreages and NWI codes of the wetlands in the 1990s and 1950s, and in the 1930s for those wetlands that occur in the six demonstration sites. A code describing the cause of the wetland trend also appears for some of the wetlands. A series of GIS maps were developed for the bay municipalities and environmental agencies and organizations. Project reports were then prepared to summarize the findings of the study. It is expected that the results of this study will be beneficial to resource managers by providing the data to develop a comprehensive strategy for the protection, restoration, and monitoring of coastal wetlands. The study area is presented in10 maps organized by municipality or groups of municipalities at 1:24,000-scale. The six demonstration sites are displayed in one map at the same scale. The municipal maps, database, acreage statistics, and project reports are available on this CD. Narragansett Bay is defined as the waters north of a line extending from Pt. Judith to Sakonnet Point, and includes the Sakonnet River, East and West passages, Providence River, Warren River System, Seekonk River, Mount Hope Bay, Taunton River, Assonet River, and Assonet Bay. The project area encompasses the Narragansett Bay shoreline areas in Rhode Island. This includes the following 18 municipalities: Barrington, Bristol, Cranston, East Greenwich, East Providence, Jamestown, Little Compton (partial-western shoreline), Middletown, Narragansett (partial-eastern shoreline), Newport, North Kingstown, Pawtucket, Portsmouth, Providence, South Kingstown, Tiverton, Warwick, and Warren, Rhode Island. Project Purpose The objectives of the project are to:
|